As you’re probably aware, there are many apps that provide the same solution as this spreadsheet aka the Sports League Table.
The beauty of the spreadsheet approach however, is that you can tweak and amend its design mechanics, making it suitable for all sporting applications.
There are two versions of this workbook…
02a – Sports League Table (10 Team – blank)
02b – Sports League Table (10 Team – with example data)
The Sports League Table Spreadsheet has the following features:
- Allows different point values to be attributed to Win/Lose/Draw scenarios.
- Ability to support 10 Teams.
- Intuitive colouring to assist initial data entry (Rules/Teams).
- Automatic generation of non-repeating but all-encompassing fixtures.
- Dates and Times can be allocated to Fixtures, so when used with the provided filters, a Fixture List can be generated (per Season/per Date/per custom Date selection).
- Once sufficient information has been entered, the League Table is live and gives a snapshot of League Position, given the results entered to that point/date.
How to use the Sports League Table Spreadsheet:
The 3 Yellow Input tabs are all you need to generate the League Table Output, shown in the Green tab.
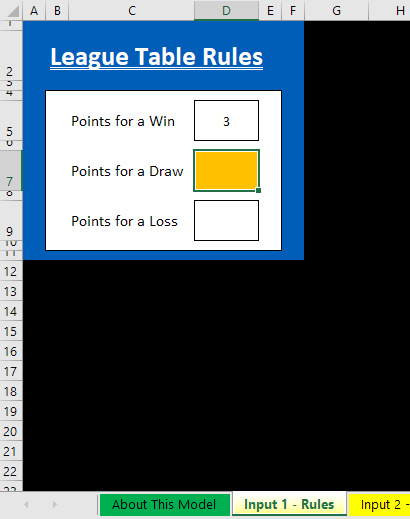
Input 1 – Rules
- Simply enter the numerical points value for each scenario.
- The Orange colouration prompt shows you the next entry to complete.
Input 2 – Teams
- Quickly and easily add your Team Names in the 10 cells provided.
- Orange colouration shows you where to add the next Team Name.
- These inputs then feed the Fixture List and also the League Table Output.

Input 3 – Fixtures
- The fixture list will automatically generate, so that there are no duplicate fixtures and each team plays each other twice (once at Home and once Away).
- Dates and/or Times can be applied to each fixture if required. These can then be filtered and sorted to generate a printable fixture list.
- As fixtures are completed, add the final scores to the fixture. This will then drive the calculations required for the League Table Output.

Output 1 – League Table
- The League Table Output will be dependent upon all of the Inputs entered.
- Your League Table will be up to date in line with the completed fixtures, for which scores have been entered.
- League Position is decided by the number of Points.
- If a team is tied on Points, the Goal Difference will be the deciding factor for Position.
- In the unlikely event that two or more teams are tied on Points and Goal Difference at the end of the season, the League Table presents the position based upon their order in the Teams Input Sheet.
- In reality, a playoff would be the best way of deciding the final league position.

So there you go…. that’s how we knock out a Sports League Table here at Dave The Spreadsheet Guy! If you have any suggestions, we’d be happy to hear them and make them a reality for you… just get in touch!
